Animated: 140 Years of Global Surface Temperatures
For hundreds of years, Earth’s average surface temperature has been steadily increasing. And over the last decade, this global heating appears to have intensified.
Since 1880, the global average temperature has risen by an average of 0.08°C (0.14°F) every 10 years, according to the National Oceanic and Atmospheric Administration (NOAA).
But since 1981, warming has been occurring at more than twice that rate, by about 0.18°C (0.32°F) per decade.
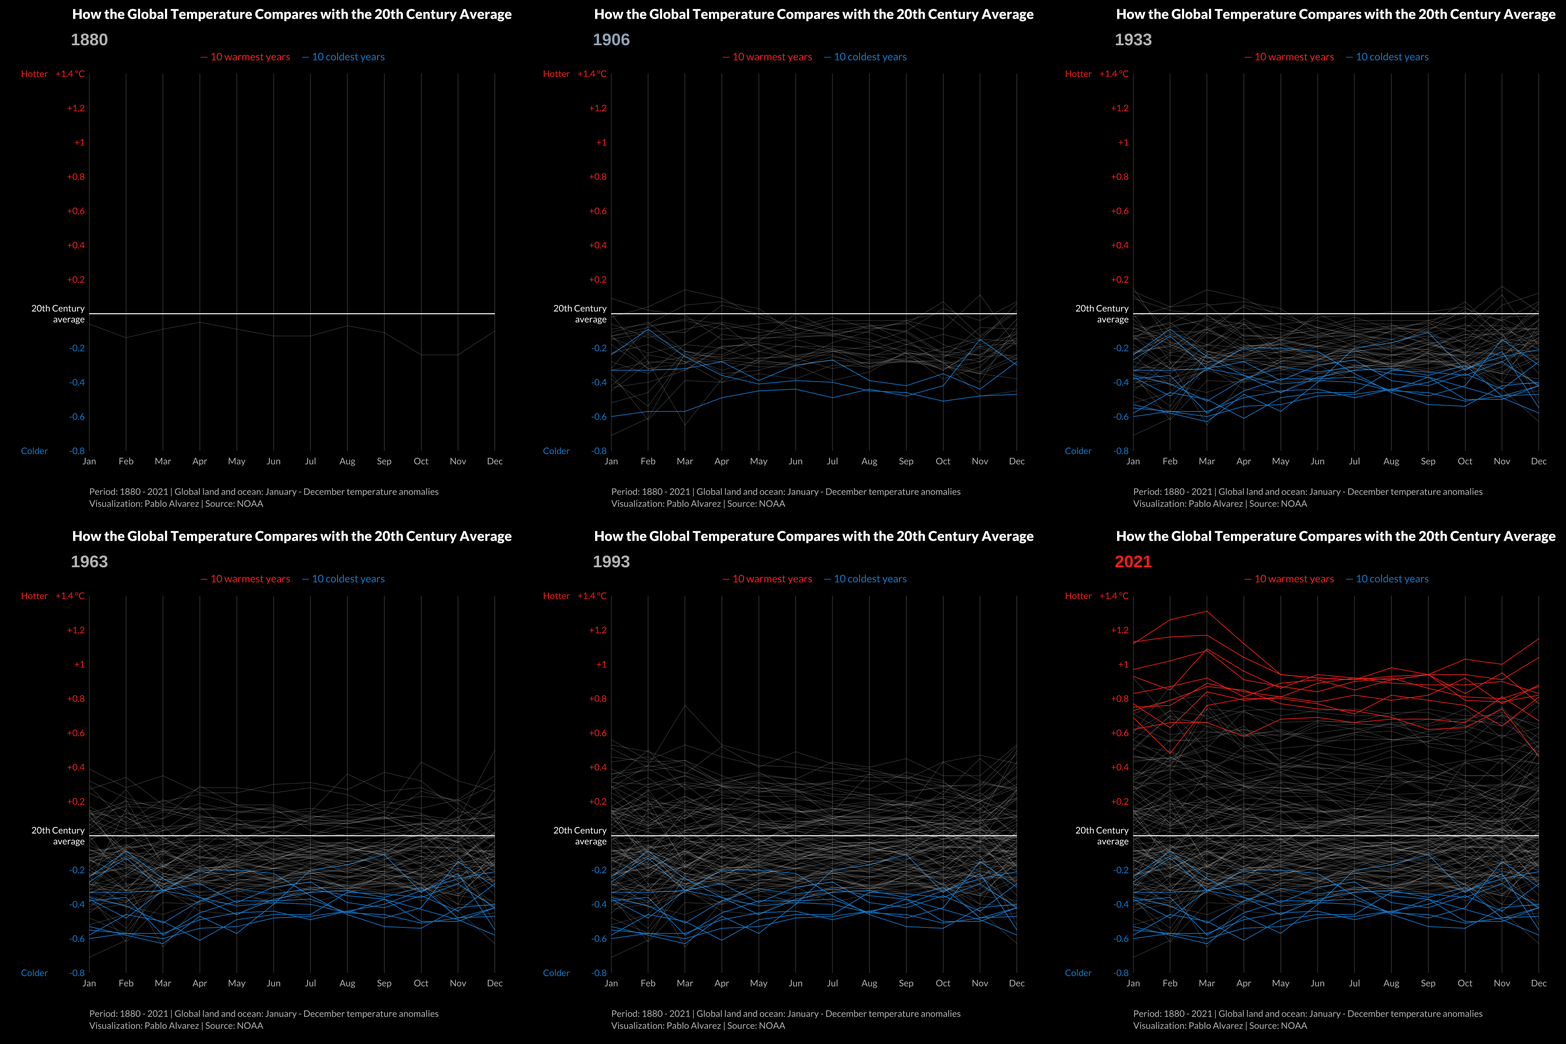
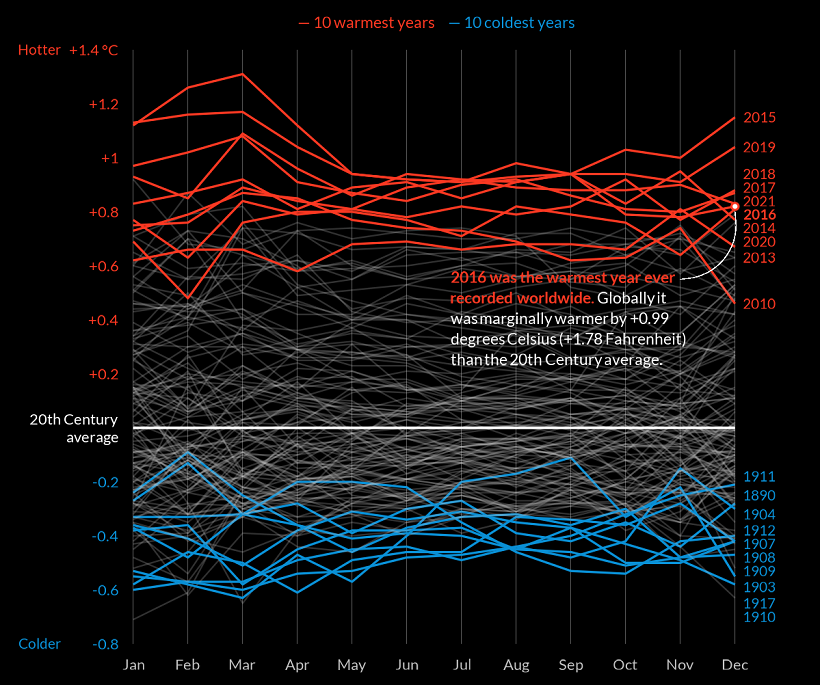
This graphic by Pablo Alvarez shows 140 years of global surface temperatures, highlighting the 10 coldest and warmest years from 1880-2021 using data from NOAA.
Global Surface Temperatures Over Time
Over the last century and a half, there have been fluctuations in global surface temperatures, with some of the coolest years on record occurring in the late 19th century and early 20th century.

However, the last two decades have seen unprecedented warming, with the 10 warmest years on record all occurring within the last 20 years. Here’s a look at the 10 hottest years since 1800, and how they compared to the 20th century average:
The 10 Warmest Years
| Rank | Year | Deviation from 20th Century Avg. (°C) |
|---|---|---|
| #1 | 2016 | +0.99 |
| #2 | 2020 | +0.97 |
| #3 | 2019 | +0.94 |
| #4 | 2015 | +0.93 |
| #5 | 2017 | +0.9 |
| #6 | 2018 | +0.82 |
| #7 | 2014 | +0.74 |
| #8 | 2010 | +0.72 |
| #9 | 2013 | +0.67 |
| #10 | 2005 | +0.66 |
As of this article’s publication, the warmest year on record was 2016, when temperatures were +0.99°C (1.78°F) above the 20th century average. After 2016, the second warmest year was 2020, when surface temperatures reached +0.97°C (1.75°F) higher than the previous century’s average.
What Factors Impact Earth’s Climate?
There are a number of natural factors that influence global surface temperatures, including phenomena such as:
- Volcanic activity
- Changes in the Earth’s orbit
- Shifts in ocean currents
However, scientists believe that our current rate of warming has been undoubtedly caused by human influence, especially because of our carbon and other greenhouse gas (GHG) emissions.
According to the most recent report by the Intergovernmental Panel on Climate Change (IPCC), “observed increases in well-mixed greenhouse gas (GHG) concentrations since around 1750 are unequivocally caused by human activities.”
In other words, while Earth’s surface temperature naturally fluctuates over the years, our actions have undoubtedly contributed to recent changes in Earth’s climate.
What Are The Consequences?
We’re already seeing the impact of this warming, as the world struggles with extreme climate events like droughts, heatwaves, floods, and an influx of wildfires in places like Europe, the United States, and Australia.
These extreme weather patterns could become the new normal if left unchecked, which is why companies and policymakers around the world are embarking on different solutions—from targeting net zero goals to implementing technological innovations that could reduce emissions.
The post Animation: Visualizing 140 Years of Global Surface Temperatures appeared first on Visual Capitalist.


